Collecting and Monitoring Application Metrics with Elasticsearch, Logstash, Kibana and Filebeat (ELK Stack)
Application metric is an important data point when it comes to working with production software. Application metrics (along with system metrics) help us determine the health of our application and even provide business-level information such as popular application features and trends. A lot of tools are available for effectively collecting and monitoring application metrics. One such tool is the ELK stack.
The Stack
ELK stack is short for Elasticsearch, Logstash and Kibana stack.
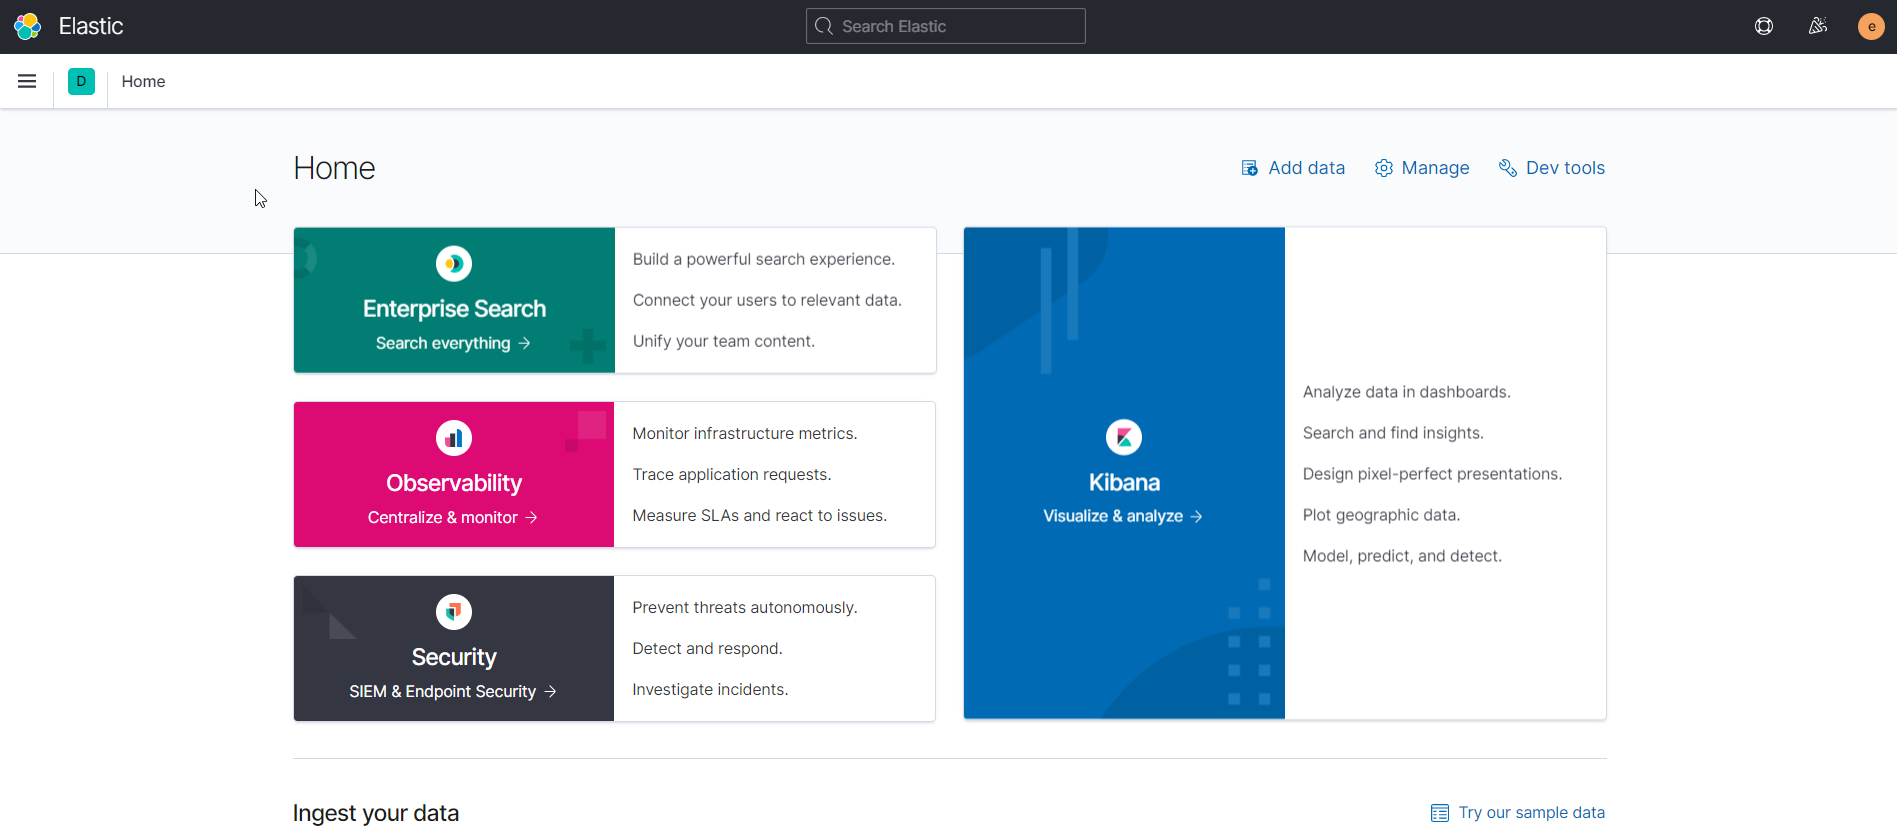
Logstash is responsible for extracting and transforming logs from the application. It is often used in conjuction with Beats which comes in many flavors. We specifically want to work with Filebeat in this case since it can be used to harvest and ship any application logs. All of these metrics are loaded into Elasticsearch for centralized storage and optimized data queries. Kibana is then served up as the user-facing interface for Elasticsearch to seamlessly navigate and visualize all of the metrics.

The HomeBrew Application
We are going to work with a simple project to help demonstrate and setup the ELK stack.
HomeBrew is a mini ReST API which allows retrieval of available beers from an imaginary beer website. It has two endpoints, GET /beer/ and GET /beer/{beerId} which fetches all beers or a single beer, respectively. The HomeBrew application generates logs for the following:
- When
GET /beer/is called. - When
GET /beer/{beerId}/is called. - When
GET /beer/{beerId}/is called but no such beer ID exists.
which all appear on the logs like so:
2020-12-12 17:28:13.6185|1|INFO|HomeBrewed.Controllers.BeerController|Retrieved all beers |url: https://localhost/beer|action: Get
2020-12-12 17:28:36.4174|2|INFO|HomeBrewed.Controllers.BeerController|Retrieved beer 1 |url: https://localhost/beer/1|action: GetById
2020-12-12 17:28:41.7105|3|WARN|HomeBrewed.Controllers.BeerController|Beer not retrieved |url: https://localhost/beer/1231|action: GetById
The next sections will describe the entire pipeline setup from collecting, down to visualizing these HomeBrew logs. For simplicity, all of the ELK stack components will be in the same Windows machine.
Setting Up Elasticsearch and Kibana
Elasticsearch and Kibana need to be set up and running so all the metrics will have some place to be loaded to. In this demonstration, we will serve both of these locally (cloud hosting could also be a better option).
Download Elasticsearch, extract the zip file, and run bin\elasticsearch.bat as described in the download page. Elasticsearch should be running in http://localhost:9200.
Download Kibana, extract the zip file, modify the config/kibana.yml to set the elasticsearch.hosts to point to the Elasticsearch instance (http://localhost:9200)
elasticsearch.hosts: ["http://localhost:9200"]and run bin\kibana.bat as described in the download page. Kibana should be running in http://localhost:5601.

Harvesting with Filebeat
Download Filebeat and extract the zip file. We will then set Filebeat to collect and send the HomeBrew logs to Logstash by modifying the filebeat.yml file.
filebeat.inputs:
- type: log
  paths:
    - 'C:\homebrew\log\*.log'

output.logstash:
  hosts: ["localhost:5044"]
This configures Filebeat to retrieve all the HomeBrew logs (in this case found in the C:\homebrew\log directory) and send them to Logstash.
Test this configuration by running:
.\filebeat.exe -e test configWhen that’s clear, run Filebeat using:
.\filebeat.exe -e -c filebeat.yml -d "publish"Filebeat will attempt to connect to Logstash. Error messages will appear until we actually serve Logstash in localhost:5044 as described in the next section.
Parsing and Loading with Logstash
Download Logstash and extract the zip file. We will then set Logstash to accept logs from Filebeat and have these logs processed to be loaded into Elasticsearch. Do this by creating a file homebrew-pipeline.conf in the Logstash directory and apply the following content:
input {
  beats {
        port => "5044"
    }
}

filter {
  grok {
    match => { "message" => "%{TIMESTAMP_ISO8601:timestamp}\|%{NUMBER:eventid}\|%{LOGLEVEL:level}\|%{GREEDYDATA:namespace}\|%{GREEDYDATA:content}\|url: %{URI:uripath}\|action: %{WORD:method}"}
  }

  date {
    match => [ "timestamp" , "yyyy-MM-dd HH:mm:ss.SSSS" ]
    timezone => "UTC"
  }
}

output {
  elasticsearch {
    hosts => [ "localhost:9200" ]
  }
}
This bit of configuration is essentially telling Logstash to listen to port 5044 where Filebeats is shipping the logs (input). The logs then go into a grok and a date filter. Grok parses the logs into a structured format - from a string, the HomeBrew log is parsed into structured data composed of timestamps, eventids, namespaces, etc. Since Logstash uses the time when the log was processed as the event timestamp, we use the Date filter so that the timestamp in the HomeBrew log is used instead. All the filtered data is then loaded into Elasticsearch which is served in localhost:9200 (output).
Test the configuration by running:
.\bin\logstash.bat -f homebrew-pipeline.conf --config.test_and_exitOnce that’s ok, serve up Logstash by running:
.\bin\logstash.bat -f homebrew-pipeline.conf --config.reload.automaticHomeBrew logs will be loaded and indexed into Elasticsearch. We can use Kibana to explore this data.
Exploring and Visualizing in Kibana
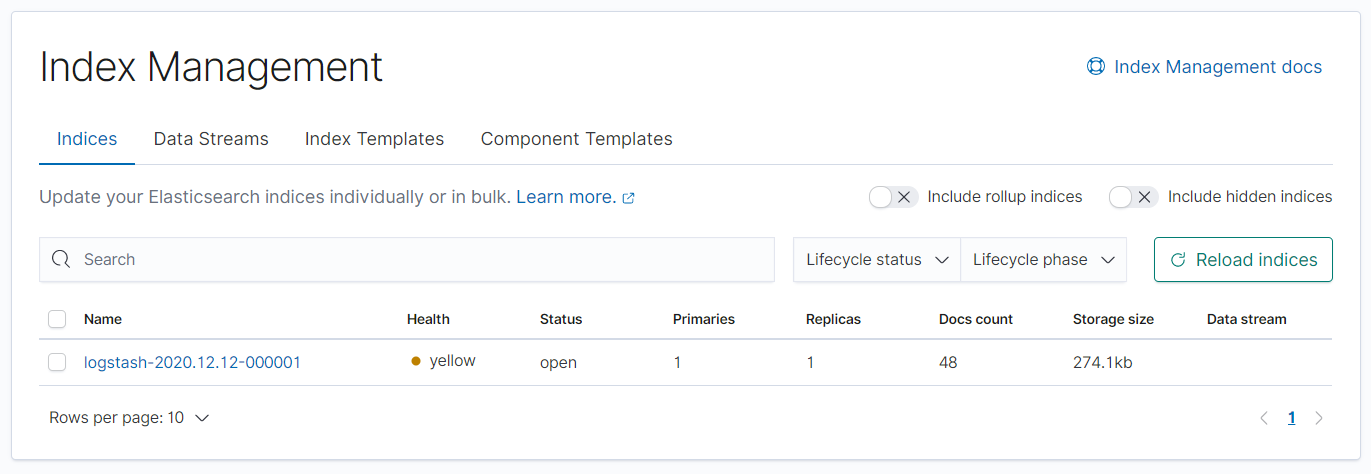
Open up Kibana which is served in localhost:5601. Go to Management > Stack Management > Index Management to find that an index has been created for Logstash logstash-yyyy-MM-dd.

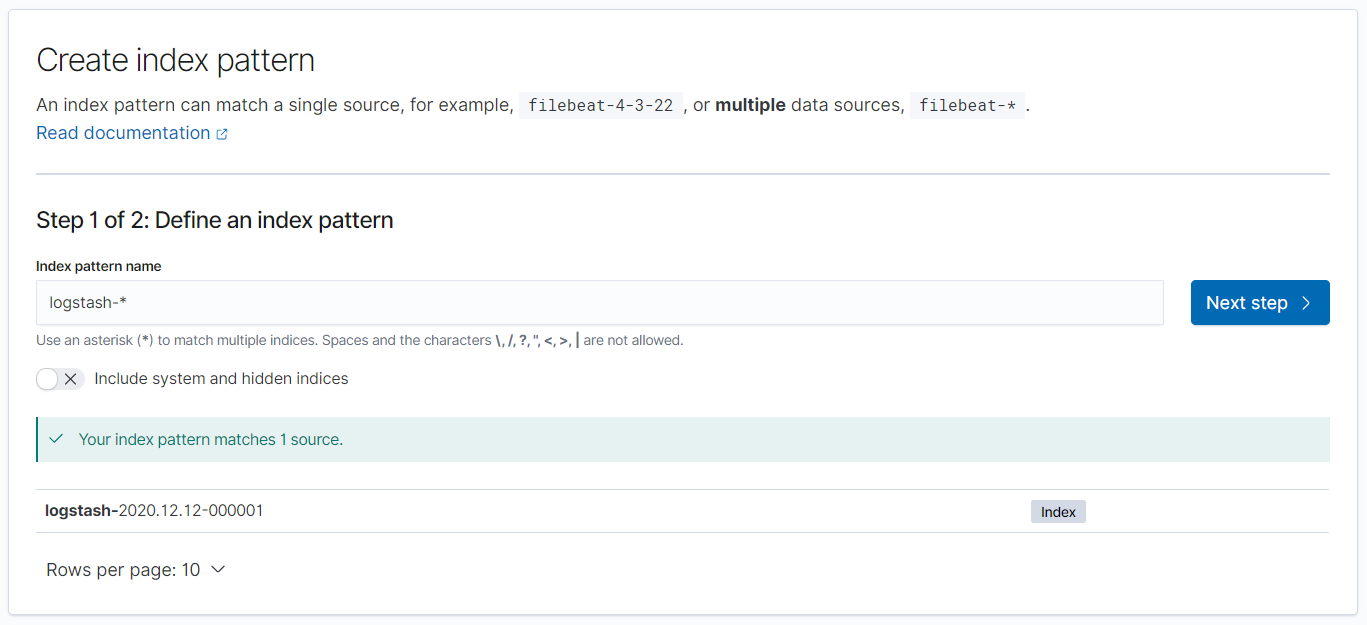
We can explore the data by creating a logstash-* index pattern in Management > Stack Management > Index Pattern.

Going to Discover, we can see a visualized timeline of the HomeBrew logs.
Since the HomeBrew logs were parsed earlier in the Logstash filter, we have the flexibility of searching logs of interest with simple KQL queries. For example, we can look at how many Warning logs were generated by HomeBrew using level.keyword : "WARN" as the search input.

The visualizations in Kibana allow us to see if there are patterns or interesting events that are logged. As described earlier, Warning logs for HomeBrew occur when API clients try to retrieve non-existent beers. Judging from the visualized results above, there are intervals where Warning events occur. This may be a starting point in investigating and determining if the API clients are using HomeBrew as intended.
Conclusion
The ELK stack provides a powerful way of collecting, centralizing and visualizing application metrics. Using these tools, events and trends in our applications can be easily monitored and analyzed.